About GoogleFinance function() in Sheets
GoogleFinance is a function in Google Sheets which allows users to retrieve current or historical financial information about stock prices, currency exchange rates, and financial metrics. This is usable for investors, financial analysis and business owners to easy compare financial data in Sheets.
How use GoogleFinance() function?
To use the GoogleFinance function in Google Sheets, you need to enter the formula in a cell and specify the financial data you want to retrieve as the function’s argument. For example, to retrieve the current price of a stock, you can enter the following formula in a cell =GoogleFinance(“ticker symbol”, “price”).
Replace “ticker symbol” with the actual ticker symbol of the stock you want to look up, and “price” with the name of the data element you want to retrieve.
You can also specify a range of cells as the second argument to retrieve multiple data elements at once. You can then use the retrieved data in your spreadsheet to perform financial analysis or create reports. It’s also possible to use the GoogleFinance function to retrieve historical data by specifying a start and end date in the formula.
Sample use of GoogleFinance function:
How get price of Amazon stock in Google Sheets:
=GOOGLEFINANCE("NASDAQ:AMZN", "PRICE")How get low52 of META stock in Google Sheets:
=GOOGLEFINANCE("NASDAQ:META", "LOW52")How setup function to get data which you want
=GOOGLEFINANCE(ticker, [attribute], [start_date], [end_date|num_days], [interval])Ticker
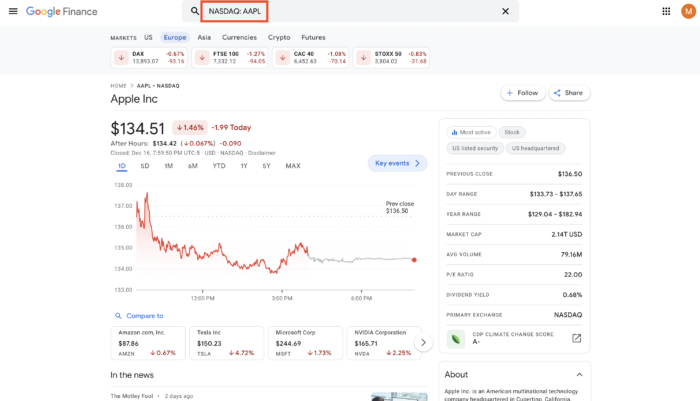
To find a ticker that works you should use Google Finance. Always is better to find what stock you want to see. After you must copy the name. In the image bellow, you could see Apple. Infamous stock for ticker could be just a name like “APPL” but if the sock is on European Stock Market then you must write ticker with a stock exchange ticket like “NASDAQ:APPL”

Basic attribute for stocks:
| Attribute | Meaning |
|---|---|
| price | Real-time price quote, delayed by up to 20 minutes. |
| priceopen | The price as of market open. |
| high | The current day’s high price. |
| low | The current day’s low price. |
| volume | The current day’s trading volume. |
| marketcap | The market capitalization of the stock. |
| tradetime | The time of the last trade. |
| datadelay | How far delayed the real-time data is. |
| volumeavg | The average daily trading volume. |
| pe | The price/earnings ratio. |
| eps | The earnings per share. |
| high52 | The 52-week high price. |
| low52 | The 52-week low price. |
| change | The price change since the previous trading day’s close. |
| beta | The beta value. |
| changepct | The percentage change in price since the previous trading day’s close. |
| closeyest | The previous day’s closing price. |
| shares | The number of outstanding shares. |
| currency | The currency in which the security is priced. Currencies don’t have trading windows, so open, low, high, and volume won’t return for this argument. |